Slack Activity Visualizations
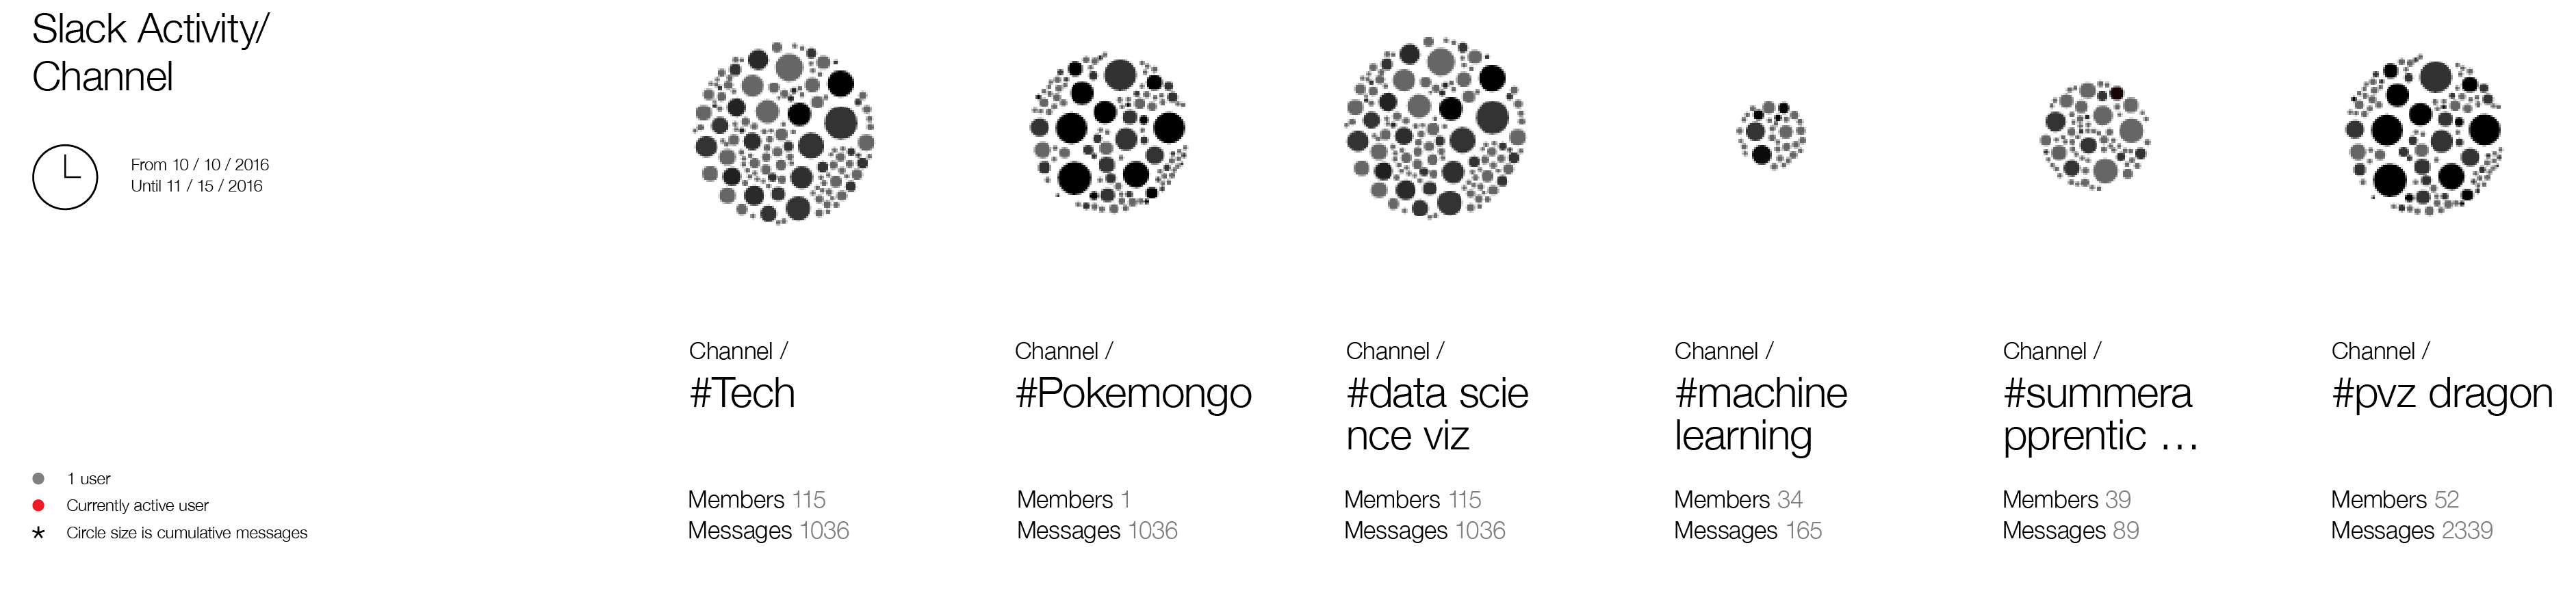
This data visualization provides a timeline of Slack channel activity over a 90-day range. Each day, channel activity across the network is analyzed and the 50 most active channels (from over 2000) are surfaced. We represent users as nodes, and their respective activity throughout the day scales up each node.
In the video below the installation is shown in-situ in R/GA's NY office.